Difference between revisions of "Security Events Search"
From Atomicorp Wiki
(Created page with "The Security Events Search window allows you to search all available data by any available criteria. ==== Saving Searches ==== If you wish to save your search criteria for fu...") |
|||
| Line 9: | Line 9: | ||
* line graph<br/>The line graph option is intended for viewing totals over time. You may select the precision of the counting by choosing a time period from the X Axis dropdown.<br/> | * line graph<br/>The line graph option is intended for viewing totals over time. You may select the precision of the counting by choosing a time period from the X Axis dropdown.<br/> | ||
* bar charts<br/>The horizontal and vertical bars options will generate bar charts like those in the Summary tab of the Security Events window. You may choose which result column to order by, which column to count by and the maximum number of results to display.<br/> | * bar charts<br/>The horizontal and vertical bars options will generate bar charts like those in the Summary tab of the Security Events window. You may choose which result column to order by, which column to count by and the maximum number of results to display.<br/> | ||
| + | |||
| + | [[File:aslw_sesearch.png]] | ||
Latest revision as of 12:28, 9 October 2014
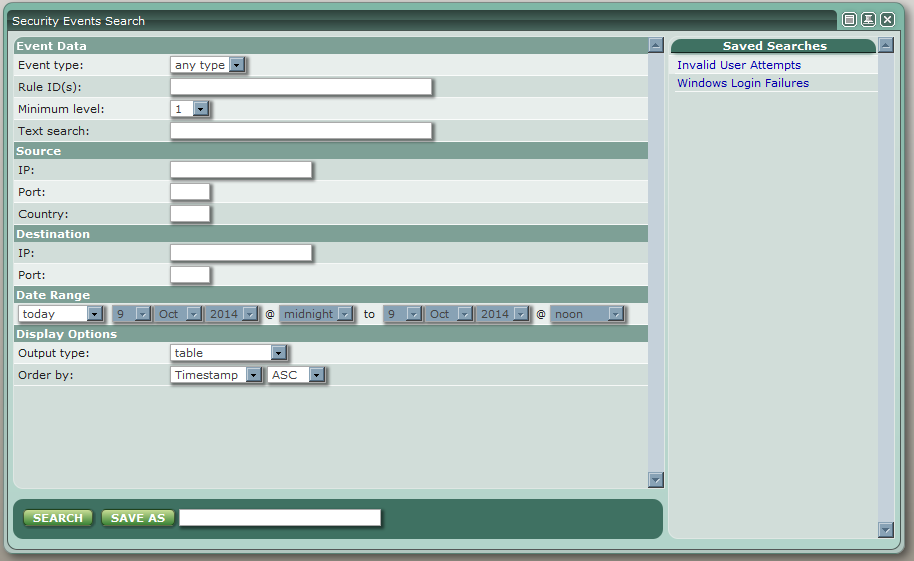
The Security Events Search window allows you to search all available data by any available criteria.
[edit] Saving Searches
If you wish to save your search criteria for future use, you may do so by entering a name for your search in the form at the bottom of the window and clicking the Save As button.
Saved searches will be listed in the Security Events Search window, and will also be added to the Reports menu dropdown.
[edit] Display Options
- table
Choosing an output type of table will display the results of your search in a format similar to that of the Recent Events tab of the Security Events window. You may also choose which result column you want the results to be ordered by.
- line graph
The line graph option is intended for viewing totals over time. You may select the precision of the counting by choosing a time period from the X Axis dropdown.
- bar charts
The horizontal and vertical bars options will generate bar charts like those in the Summary tab of the Security Events window. You may choose which result column to order by, which column to count by and the maximum number of results to display.
